For many years I've been looking for and collecting stats on the value of Multi-CDN. I'm aware of several interesting data points I thought I would share.
Studies of Potential:
Cedexis Radar: Cedexis published some numbers indicating both the scope of benefit i.e. what percentage of the audience would benefit from the use of multiple CDNs along with some limited data on scale i.e. how much would the improvement be. The Cedexis S Curve data demonstrates that 50% of your audience will see a "significantly better experience" globally with 2 CDNs. Limited to the US, the improvement impacts 25% of the audience.
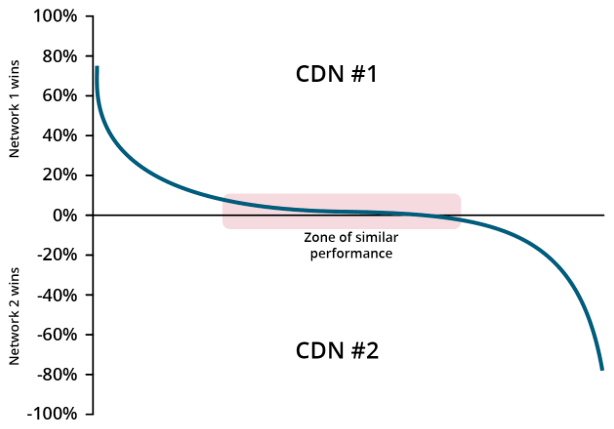
Cedexis also published a study of SSL content with 2 top tier CDNs. In this study the data shows improvements where CDN A was better globally 40% of time, and 10% of time the improvements were 40% or more. CDN B was better in the US 55% of time, and 10% of time the improvement was 20% or greater..
Concurrent Synthetic Probes: While working with a large VoD Subscription Service provider, we performed a broader set of tests using 5 top tier CDNs (Akamai, Level 3, Limelight, Comcast, Verizon/Edgecast).collecting both RUM and Synthetic data. The goal of the test was to determine the impact of reducing the number of CDN Vendors. What's interesting about this effort is that we conducted the tests a bit differently than Cedexis but came up with very similar results. This provided additional perspective and corroborates the benefits.
The Cedexis data was collected from RUM (Real User Measurements), via a very broad audience, and used a very small object (100KB). There are a few factors to unpack regarding differences between these tests.
To establish a baseline, the test compared 5 CDNs to determine the best performing single CDN over the full period of the test. We then compared the baseline to the best performing CDN at any given moment and showed an average potential improvement of 23% for our US audience (best at moment vs. best on avg.) Performance variance was greater during peak usage and when comparing best vs. avg. or worst.
To put the resulting improvement in perspective, it is significant enough to shift the player's algorithm to request the next bit rate up the ladder i.e. from SD to HD.
Concurrent Synthetic Probes: While working with a large VoD Subscription Service provider, we performed a broader set of tests using 5 top tier CDNs (Akamai, Level 3, Limelight, Comcast, Verizon/Edgecast).collecting both RUM and Synthetic data. The goal of the test was to determine the impact of reducing the number of CDN Vendors. What's interesting about this effort is that we conducted the tests a bit differently than Cedexis but came up with very similar results. This provided additional perspective and corroborates the benefits.
The Cedexis data was collected from RUM (Real User Measurements), via a very broad audience, and used a very small object (100KB). There are a few factors to unpack regarding differences between these tests.
- First, in general, RUM Data reflects variations in delivery infrastructure + access networks + home networks + user devices. Variations in all of these elements affect the results. Our goal was to better isolate the performance impact of the delivery infrastructure and for this reason we used synthetic probes.
- A second characteristic of the Cedexis methodology was the use of small files where the throughput has greater variance. This occurs because typical client behavior is to connect to a server until there is a catastrophic failure in the connection and during the lifespan of a download for larger files, we’ve observed server throughput can vary considerably. With a small file, throughput looks at a very small measurement window and does not represent how an ABR (Adaptive Bitrate) video player will perform connected to that server. For example, video segments are typically several megabytes (which varies with encoding parameters). When measuring many small files (100 KB), we see results with much higher and lower throughputs vs. a larger (10 MB) file that was more representative of a video segment file size at the time the test was conducted. The larger file size gives us an avg. of an avg. and thereby dampens the variance. This method more closely approximates what we would expect to see with the Average Bit Rate measurement and so the test was conducted with a 10 MB file.
- A third difference is that RUM collection is initiated at slightly different times where the device and network conditions also vary. Our goal was to determine the performance improvement that could be realized by better optimizing server selection across available options. The synthetic test was conducted from probes which originate in data centers where the requesting clients network connectivity, processing capacity, and load is very predictable. The most significant difference is that our synthetic tests allowed us to initiate requests to all five CDNs at the same moment.
To establish a baseline, the test compared 5 CDNs to determine the best performing single CDN over the full period of the test. We then compared the baseline to the best performing CDN at any given moment and showed an average potential improvement of 23% for our US audience (best at moment vs. best on avg.) Performance variance was greater during peak usage and when comparing best vs. avg. or worst.
To put the resulting improvement in perspective, it is significant enough to shift the player's algorithm to request the next bit rate up the ladder i.e. from SD to HD.

Studies of Production Improvement:
A/B Analysis (over time): At various points, I've worked with clients performing A/B comparisons where RUM data was collected during a period we'll call week 1 when a single CDN is used and then compared to week 2 data when multi-CDN load balancing is employed. For these tests, the results range from roughly a 5% improvement to more than 20% for well architected, and professionally operated web sites using a top-tier CDN. The breadth of resulting improvements was affected by the load balancing methodology and the improved delivery architecture.
Real Time Player Switching: Another method is to compare how much improvement is realized during production optimization. The best optimization technique I’ve observed utilizes the player to assist in server selection or to control CDN selection. This enables optimization to become very granular and realizes more of the potential mentioned previously.
Though it’s been around for a while, today there are only a handful of companies which employ real-time, segment-level player-driven selection i.e. where the player samples real-time performance to assist in CDN/Server selection. There are some variations in how this technique has been implemented but overall it seems to be the best approach. Trials have shown improvements ranging from 5% to well over 50% but I’ll try to simplify expectations to the range of 10-20%. The factors which enabled improvements of well over 50% were where the baseline was a lower tier CDN with a limited global footprint, and where the site had a significant global customer base. Conversely, the factors limiting improvements to 5-10% were simply poor execution. Tuning had a big impact on performance and we’ve seen results jump from 5% to 15% or 20% with a little effort.
The Bottom Line:
There is a growing body of evidence that optimizing server selection, in conjunction CDN Load Balancing and a sound logical architecture can yield KPI improvements on the order of 20-25% or potentially higher. Recently I’ve been exploring methods to push the impact beyond this range and believe future work will demonstrate this.
To summarize, if you’re currently using a single CDN and relying upon their algorithm alone for server selection, there is room for improvement. All of the data we've seen suggests that application of a well thought through method of multi-CDN load balancing can return improvements in excess of 20%.
The difference between a poorly designed and a highly effective system of multi-CDN load balancing is:
- the ability to switch mid-stream
- how close to real time the selection point is
- how accurately the data reflects your users
- how well the switching logic protects against a broad variety of risks
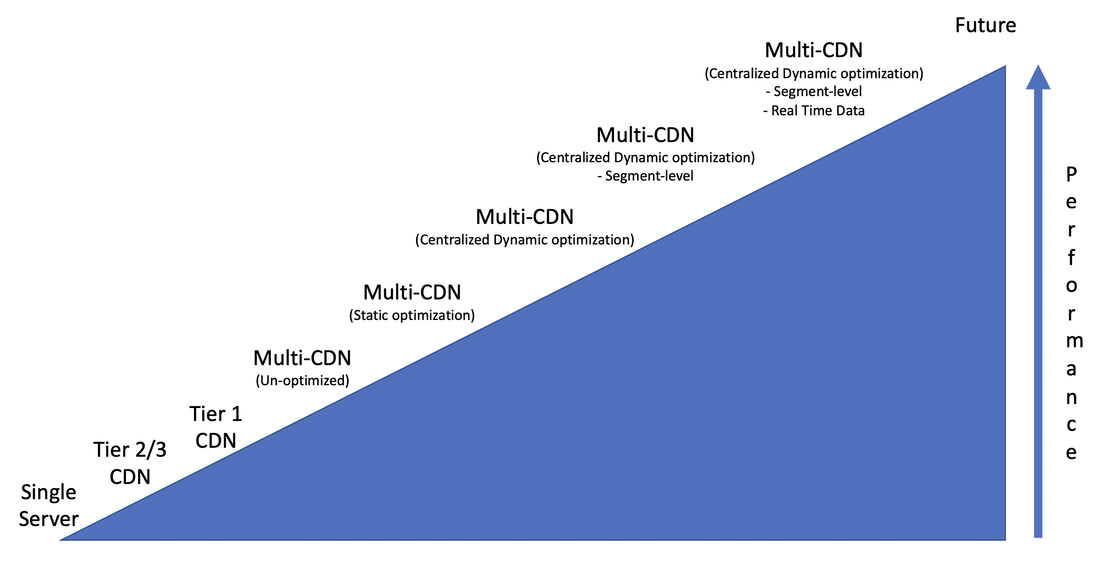
Following shows the relative performance of server selection methods:


 RSS Feed